For a couple of months now I play around with the trackservice dataset obtained from the Austrian radio station FM4. One of the early results was a starmap of Sunny Side Up. This week I was finally able to finish the cleanup process and to start some evaluation (Hooray!).
Before we begin, a remark about the cleanup and the dataset itself.
Summary of the cleanup
The dataset I am using is from 2007 to 2017 and consists of:
- Playtime, when was a track played
- Name of the track
- Name of the artist
and it covers most of the day, the radio program can be found here. Special programs and live-sets were not covered (at least in 2003, details here ) and I am not sure if requests by the listeners were included from the beginning, more on this later. On average there is a decent track-wise coverage from 6:00 up to 22:00.
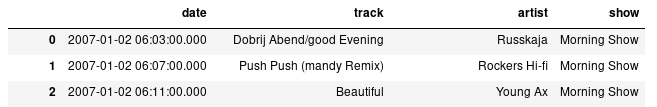 Example of the FM4 Trackservice dataset.
The "show" column was created based on the date.
Example of the FM4 Trackservice dataset.
The "show" column was created based on the date.
The definition of FM4 according to wikipedia:
Its main target is the youth audience, and much of the music output is characterised by an alternative rock and electronic music slant.
Hence, I expect a rather diverse radio program, with a variety of genres and artists (in contrast to powerplay by other radio stations). To falsify my expectation was one of my motivations to look into this dataset.
To get a clear picture some filtering was needed:
- Only tracks played from Monday to Friday were considered
- Holidays were neglected since there is then a special theme for most of the programs
Selection of the core shows. In my case:
- Morning Show
- Update
- Reality Check
- Connected
- Homebase
- Auf Laut
FM4 Unlimited was ignored since it plays music that is rather in contrast to the rest of the shows and I am interested in the main style/playtime.
So nearly all of the shows in the filtered set are on air Mo-Fr, hence the distribution of tracks in the dataset should be more or less even.
The main part was the cleanup of the set. I do not know how the tracks are entered into the trackservice, but I am pretty sure that there is a certain amount of manual typing involved. One can see that from inconsistencies in the spelling of artist names, typos and mixed artist names involving the word “The” (like Kooks vs The Kooks). Also sometimes a featured artist is named explicitly and sometimes not as well as swapping of track and artist randomly.
Additionally, sometimes there are contributions to the show, like an interview or a report from a festival is dropped into the set as well. One can see that there is no easy way to automatically clean up the dataset. Hence, the whole cleanup process was rather labor intensive:
- First, I identified certain keywords associated with the contributions and filtered them automatically.
- Second, I started to look at each track/artist row manually and fixed the order and spelling errors (if I could find one).
- Third, duplicate artists were identified, again manually, and merged. The same thing goes for the featured artist, were for the sake of brevity they were neglected.
A blog post about the details on the cleanup process itself as well as some cases I encountered is in the making. Until then one can look at my LinkedIn post for some funny examples.
The first two steps of the cleanup already reveal some interesting results!
Warning!
The following uses the altered dataset, which does not cover the whole playtime. I tried my best to avoid errors, but take everything with a grain of salt. Also since the dataset was not monitored by FM4 themselves!
Effect of the cleanup
After such an elaborate task, one needs to know how many changes were performed in the end. Therefore I counted the number of tracks in the set for each month and show before and after the cleanup and calculate the difference. The result can be seen in the following figure.
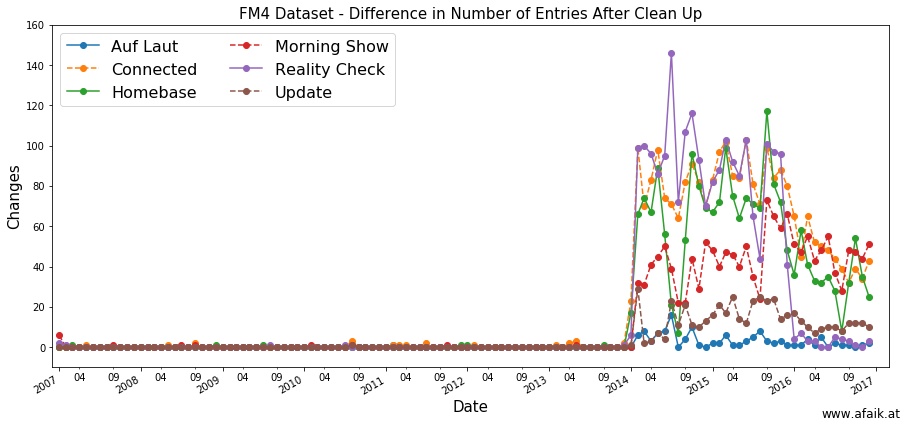 Number of removed datapoints per month
One can clearly see the drastic amount of changes performed starting in 2014, applied to all shows, besides Auf Laut. By doing this calculation again for the first two cleaning steps separately one can see what’s going on.
First the automatic cleanup:
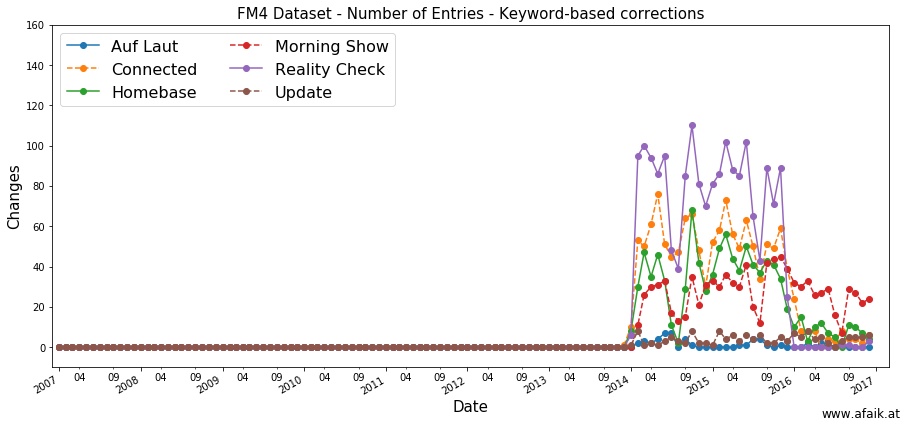 None of the specified keywords occur before 2014! and most of the shows only
used those between 2014 and 2016, with the exception of the Morning Show.
None of the specified keywords occur before 2014! and most of the shows only
used those between 2014 and 2016, with the exception of the Morning Show.
Similar results can be shown for the second step:
 Here again the major changes are happening after 2014 and minor modifications before that
(while writing this post I identified an invalid removal from that time period, hence the numbers go down there)
In this step, the majority of deletions were due to an inconsistent naming
of the small contributions to the show, e.g. a movie review.
Here again the major changes are happening after 2014 and minor modifications before that
(while writing this post I identified an invalid removal from that time period, hence the numbers go down there)
In this step, the majority of deletions were due to an inconsistent naming
of the small contributions to the show, e.g. a movie review.
(By the way, the movie segment Close Up was rather annoying since the name is also used as a title for various tracks)
How many new artists?
How many “new” artists are introduced to the audience each year? That one is a tricky question since not every band/artist that is played for the first time also emerged simultaneously. Also, there are some shows that play tracks recommended by the listeners and which might not be played anymore after that. The last one can be solved by removing artists that are only played less than twice in the dataset.
For the first part, I am still lacking a solution. The problem is two-folded: An artist might have been played on FM4 before 2007. Hence it is not an “introduction” to the artist. To check one could compare the artists with another dataset like discogs.com and try to obtain their founding date. That way one could identify artists that were certainly first played in the timeframe of interest, i.e. Wanda founded in 2012. However, the remaining artists are still unresolved: Some musicians are active for a long time before they are played on the radio. Hence were they already covered or not? For that one could use the samplers sold by FM4 (first came out 1998!) and try to minimize the number of artists even more.
However, since the comparison with a database is again a matching problem that might need manual labor, I decided to postpone that for now and only group artists, which were played for the first time in a specific year.
As the dataset starts at 2007, every band in that year would be new.
Hence that year is skipped in the following figure:
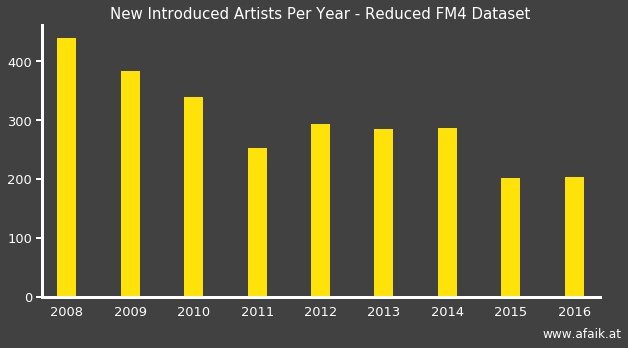 First, one might see a decline in the number of new artists.
However, one has to keep in mind that there might be a fair amount of artists that
were already featured before 2007 and could simply have a comeback.
First, one might see a decline in the number of new artists.
However, one has to keep in mind that there might be a fair amount of artists that
were already featured before 2007 and could simply have a comeback.
Nevertheless, this effect fades out as time proceeds and it is reasonable to assume that with 2010 it might have vanished. From there it is an up and down between 200 and 300 “new” artists being played. Of course, this neglects the possibility that someone was already featured before, e.g. The whitest boy alive - the follow-up band from a member of Kings of Convenience. But since it is a “new kind” of music, it is safe to say to that the artist is “fresh”.
Are these numbers huge? Well, that depends. In comparison to 250 days (50 weeks per year, as a first approximation for the compensation of the holidays and 5 days a week) the range fits nicely. However, every band/artist that is played more than twice is considered to be equal in the set. It is disputable if an artist that has been played only three times counts as a new introduction or more as a collateral damage in terms of playtime.
Was it justified to remove artists that were only played twice?
Here is a comparison between the full dataset (left bars) and the reduced one (right bars)
stacked according to the shows:
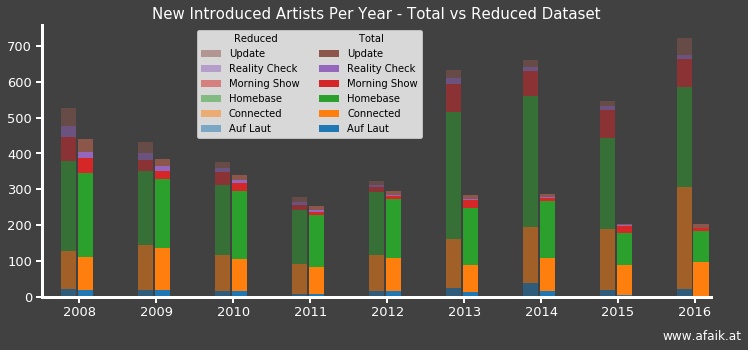 Up to 2013, the difference is rather small, followed by a prompt jump similar to the cleanup discussion.
I can only guess that they were then able to fill the dataset with non-conventional
media like the internet that lead to a higher overall count.
Maybe that wasn’t possible before?
Up to 2013, the difference is rather small, followed by a prompt jump similar to the cleanup discussion.
I can only guess that they were then able to fill the dataset with non-conventional
media like the internet that lead to a higher overall count.
Maybe that wasn’t possible before?
What one can say is that the majority of new artists in both sets come from:
- Homebase
- Connected
- Morning Show (most of the time)
Which makes sense, since the first two shows are within the reach of their core audience (I guess) and this is the time where you want to place new artists. Furthermore, the other shows seem to lose their importance in terms of “fresh” artists over time, like Update or Auf Laut in 2015 (the statement holds for the whole time period)
This does not tell how diverse these shows are. Thus, are the same artist played all over again or is there a good mix?
How diverse are the shows?
While searching for a “good” quantity to measure diversity I stumbled upon two indices which are used in biology. Both assume that one has a limited number of different species S in an area and one has to count the number of specimen n for each “thing” in S. They then provide an index (= a plain number) that will also be normalized. This way, one gets a number between 0 and 1, where a diverse set is close to 1 and an in-balanced one is close to 0.
In our case S will be the different artists and n is the number how often they were played in a time interval!
First the Shannon-Index:
Shannon-Index
It is defined as, $$ \mathrm{H}=-\sum_{i\in S}p_i\log{[p_i!]} \ \ \mathrm{with} \ \ p_i = \frac{n_i}{N} \ , $$
with the total number of counts:
$$ N=\sum_{i\in S}n_i $$
Thus we count for each artist how often he/she was played (n), calculate their contribution (p) and sum everything. To make it more seizable, the Pilou evenness can be used: $$ \mathrm{E}=\frac{H}{\log{S}} \ , $$
The result of this procedure is shown below.
However, the Shannon-Index assumes that the exact number of S is unknown (which makes sense, since nobody can say for sure how many different kinds of animals live in a jungle for example). In the music case, it is more or less known how many different artists were played. The only uncertainty is in terms of errors by the data providers, e.g. radio show host, or errors introduced by cleaning up the set, i.e. my fault.
Hence the exact number of S for the music set is known with a higher certainty than S of a jungle, but it is not the ground truth. Hence this index was applied to the dataset. For sets were more information is available the Brillouin-Index should be used.
Brillouin-Index
Here, it is the same procedure as for the Shannon-Index, but the equation differs: $$ \mathrm{H}=\frac{\log{[N!]}-\sum_{i\in S}\log{[n_i!]}}{N} $$ However, I did not find a proper definition of evenness for this one. Hence I came up with my own ansatz (I am pretty sure a proper equation is already written down somewhere else [CITATION NEEDED] ): $$ \mathrm{E}=\frac{N H}{\log{[N!]}} $$ I assume that the maximum in terms of diversity is reached if one finds the same number n for each species in S . In our case, this means that n=1 as the radio-shows could play completely random artists the whole year without a duplicate. Since the logarithm vanishes for the unity argument, the maximum simplifies to the denominator above.
Both evennesses are shown below.
Warning!
Do not compare the lines. A lot more statics needs to be done to obtain reasonable results in terms of comparision! At this point they can only be used to identify a trend.
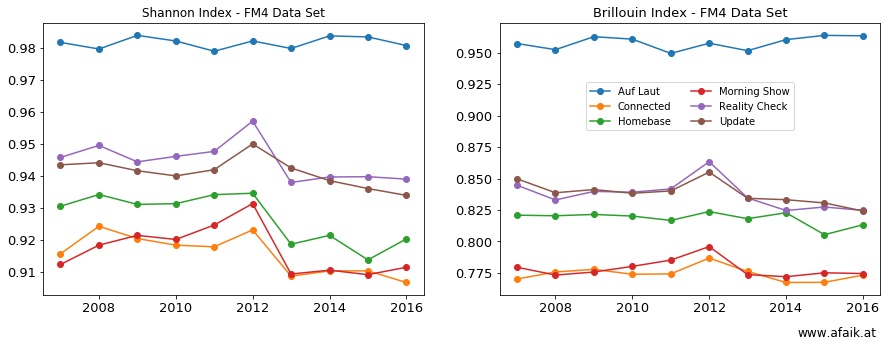
It is tempting to compare the lines in both figures, however, one can not do that since the sample sizes are all different. There are different methods how to compare the indices, but it was beyond the scope of today’s post.
Nonetheless, it can be stated that all curves are more or less constant (mind the scale), with a small bump for most of the shows at 2013, more pronounced for the Shannon-Index case. My guess is that starting with 2013 more data was introduced and that lowers the evenness.
Be that as it may, something was changed between 2013 and 2014! The what needs more investigation.
Next up: Networks!
Found an error or you have something to comment? Drop me a line!